Course ID: bbrnmebe5_vod
All Courses
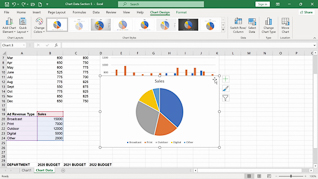
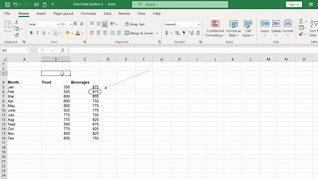
Mastering Excel 365 – Beginner Part 5: Charts And Graphics
Visualizing data makes it easier to identify trends and communicate insights, which is why charts remain one of Excel’s most widely used features. This course teaches you how to create charts and insert graphics that make your spreadsheets more engaging and easier to understand. You will learn how to present data visually, highlight key information, and build reports that are both professional and easy to interpret. The result of this course is simple: clearer communication and more impactful spreadsheets.
2 Lessons
9-10 Minutes
en
HD
1 Questions
Course Details
Preview
You Might Also Be Interested In:

1 Lessons | 5-8 Minutes
Using AI Safely And Securely: Best Practices

1 Lessons | 9-12 Minutes
Using AI Safely And Securely: Five Major Risks

1 Lessons | 7-10 Minutes
Using AI Safely And Securely: Proper Usage

5 Lessons | 6-9 Minutes
AI Can’t Empathize But You Can

5 Lessons | 9-12 Minutes
AI For HR Professionals

5 Lessons | 7-10 Minutes
AI For Marketing Professionals

5 Lessons | 5-8 Minutes
Build Your AI Playbook

5 Lessons | 7-10 Minutes
AI At Work: ChatGPT For Managers

5 Lessons | 6-9 Minutes
AI Basics: Introduction to ChatGPT And Large Language Models (LLMs)

4 Lessons | 26-28 Minutes