Course ID: bbrnmeba4_vod
All Courses
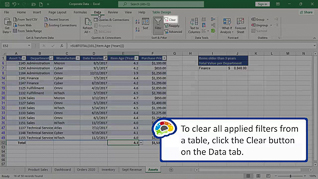
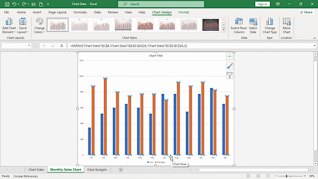
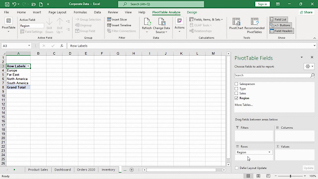
Mastering Excel 365 – Basics Part 4: Charts And Tables
This online training course introduces Office 365 users to creating charts, tables, and PivotTables in Microsoft Excel 365. Users taking this course will learn how to organize and present data more effectively using Excel’s built-in tracking and reporting tools. Throughout the course, learners see how to create and modify different chart types to display information clearly and professionally. The training also explains how to update chart source data, customize chart elements, and format tables for improved organization and readability. In addition, employees learn how to create PivotTables to quickly summarize, analyze, and interpret larger amounts of data.
4 Lessons
24-27 Minutes
en
HD
3 Questions
Course Details
Preview
You Might Also Be Interested In:

6 Lessons | 34-37 Minutes
Mastering Excel 365 – Basics Part 1: Editing
8 Lessons | 60-63 Minutes
Mastering Excel 365 – Basics Part 2: Functions
5 Lessons | 40-43 Minutes
Mastering Excel 365 – Basics Part 3: Formatting
4 Lessons | 24-27 Minutes
Mastering Excel 365 – Basics Part 4: Charts And Tables
3 Lessons | 25-28 Minutes
Mastering Excel 365 – Basics Part 5: Printing

5 Lessons | 7-10 Minutes
AI For Accountants

5 Lessons | 6-9 Minutes
AI Personas: Prompting with Roles for Better Responses

5 Lessons | 6-9 Minutes
Brainstorming With AI: Hacks For Unlimited Ideas

4 Lessons | 4-7 Minutes
AI At Work: Write Better Emails With Chat GPT

1 Lessons | 8-8 Minutes